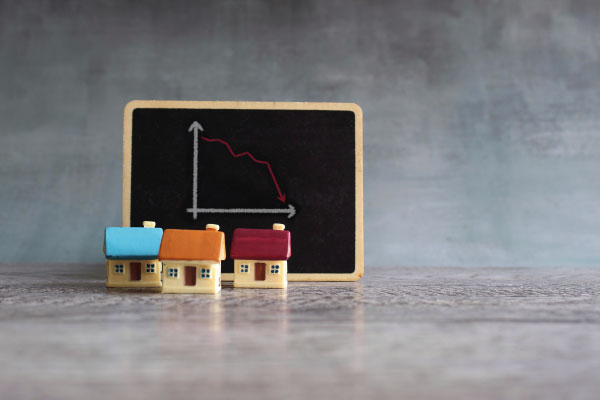
What's Ahead for Home Sales and Prices?
Pending Home Sales fell 4% from October to November, marking the sixth straight monthly decline. Sales were also 37.8% lower than they were in November of last year. This is a critical report for taking the pulse of the housing market, as it measures signed contracts on existing homes, which represent around 90% of the market.
1. Pending Home Sales
Lawrence Yun, chief economist for the National Association of Realtors, noted, “Pending home sales recorded the second-lowest monthly reading in 20 years as interest rates, which climbed at one of the fastest paces on record this year, drastically cut into the number of contract signings to buy a home.” However, he explained that there is typically a two months’ lag time between mortgage rates and home sales and “with mortgage rates falling throughout December, home-buying activity should inevitably rebound in the coming months and help economic growth.”
YOU MIGHT LIKE: 5 Steps For Getting Your Mortgage Pre-Approved
The Federal Housing Finance Agency (FHFA) also released their House Price Index, which showed that home prices were flat from September to October but they were 9.8% higher than they were in October of last year.
2. Home Prices Have Softened But Annual Appreciation Is Still Strong
The Case-Shiller Home Price Index, which is considered the “gold standard” for appreciation, showed home prices fell 0.5% in October but they were 9.2% higher when compared to October of last year. This annual reading is a decline from the 10.7% gain reported in September.
The Federal Housing Finance Agency (FHFA) also released their House Price Index, which showed that home prices were flat from September to October but they were 9.8% higher than they were in October of last year. This is a decline from the 11% annual increase reported in September. FHFA’s report measures home price appreciation on single-family homes with conforming loan amounts, which means it most likely represents lower-priced homes. It also differs from Case-Shiller’s data, in that it does not include cash buyers or jumbo loans.
3. Case-Shiller's Index
Home prices have been softening, but Case-Shiller’s 9.2% annual gain “is in the top quintile of historical performance levels,” per Craig J. Lazzara, Managing Director at S&P DJI. And while home prices are now down 3% from their peak, this is a far cry from a housing crash of 20% that some in the media are predicting.
In addition, Case-Shiller’s 10-city and 20-city Indexes are down 4.6% from their peak, showing that home prices in the major cities are declining a bit more than they are across the nation overall. Note that several of these cities were somewhat overheated and are now giving back a little more price-wise. However, most of the major cities saw less of a price decline in October than they did in September, which could be a sign that markets are slowly improving.
DG PINNACLE RECOMMENDS: 6 Ways to Come up With a Down Payment
most of the major cities saw less of a price decline in October than they did in September, which could be a sign that markets are slowly improving.
4. Challenges Remain for Job Seekers
The number of people filing for unemployment benefits for the first time rose by 9,000 in the latest week, as 225,000 Initial Jobless Claims were reported. Continuing Claims, which measure people who continue to receive benefits after their initial claim is filed, saw another large increase of 41,000 to 1.71 million.
Continuing Claims have now risen by 346,000 since the beginning of October, reaching their highest level since early February. This is another sign of a potential slowdown in the pace of hiring, suggesting it’s becoming harder for many to find a job once they’re let go.
This article was originally published in www.mbshighway.com


